Understanding and commercially managing the usage cycle of business applications
For companies with a diverse and perhaps even dispersed application landscape that spans multiple regions, it is not always easy for the IT department to maintain a sound overview of just how exactly all of the applications are being used:
- Which applications are used most?
- Which are used to a lesser extent?
- How has usage developed in recent months?
- Where will more or fewer resources need to be allocated in future?
- Can users log in successfully?
- Which methods do users utilize for multi-factor authentication?
Keeping an eye on all of these factors allows you to better manage your IT resources, optimize the user experience for employees and improve security measures such as authentication. We can present a pragmatic solution for this here: reporting for all apps registered in Microsoft Entra ID, which can be implemented with Microsoft Cloud (Azure) and Power BI to suit the relevant prerequisites and requirements within your company.

Transparent dashboard
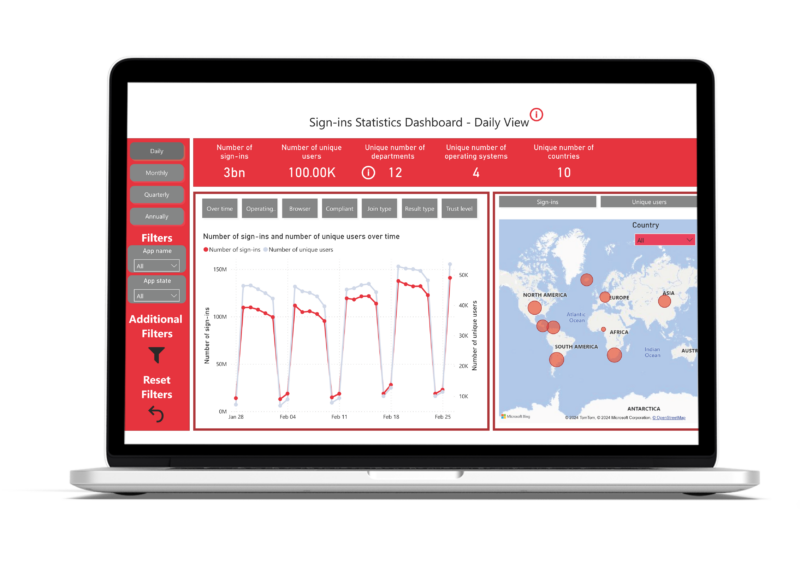
The core of the app reporting tool consists of a dashboard in which you can chart various KPIs and trends at a glance, for example:
- Number of sign-ins and users on a daily basis over all applications
- Map display showing the use of all applications at all locations, with filter options for different regions, countries, branches, etc.
- A breakdown of usage behavior for specific applications, e.g., by day, quarter, year or by browser, end device and operating system.
Convenient and compliant reporting for all stakeholders
Practical filter functions provide you with individual reports containing the data that is relevant to you. This type of report can be used by various groups of people, in particular app owners, development teams and administrators. We use row-level security (RLS) – a line-by-line access control in Power BI for this purpose. In this example, access control means that employees only see the statistics for their own applications, and administrators get an overview of all applications. This control is performed via security groups in Microsoft Entra ID and can be customized as required. This ensures that all employees see the data relevant to their area of responsibility and that compliance requirements are adhered to.
Easy use and maintenance
You can use the reporting dashboard as a separate Power BI application in your company within a dedicated Power BI workspace. All authorized stakeholders in the company’s own Microsoft 365 Apps Marketplace can access it.
The data basis for this solution is the sign-in logs of the applications that are already recorded in your Microsoft Azure environment. If necessary, they can be quickly supplemented with additional data, e.g., application or security information from data sources outside Entra ID. Using Azure functions , the data can be transformed, merged and aggregated in an efficient and streamlined manner. Additional data infrastructure such as virtual machines are not required – the entire solution is one based on a platform-as-a-service approach. Auditable versioning of the entire value chain is also covered: from code (e.g. in Python) to data preparation in the version management tool (Git), from the cloud infrastructure (infrastructure-as-code via Terraform) to Power BI (Power BI desktop project).
The solution is especially suitable for companies that already use the Microsoft Cloud (Azure) and Power BI, as the reporting feature integrates seamlessly into existing processes and no additional software is required.
If you would like to discuss this or other reporting solutions relating to IT security, please contact Dr. Anna-Lena-Wölwer.


