
Navigating the data jungle: using data maps to unearth data treasures and make them accessible
Data provide insight, make progress measurable and accelerate processes – don’t they? In many a department, despite – or perhaps because of – the growing volume of data, the exact opposite is the case. We talked to Dr. Markus Knappitsch about the reasons behind this and how data maps can help.
Markus, in your role as a data strategist, you advise a wide variety of companies on how they can use their data more profitably. What challenges do you keep encountering along the way?
There are two typical scenarios: the first is where companies lack sufficient data to introduce AI solutions such as smart customer assistance systems or smart maintenance, for example. In fact, it is often the case, especially for smaller companies, that they first have to create the quantitative data basis for this – either by purchasing additional data or by “borrowing” data, such as in the form of federated learning scenarios. This mostly applies to the core processes of industrial companies, but also to medium-sized insurers. Even more common across all sectors, however, are cases in which back-office processes are virtually overflowing with data. These companies simply lack the insight needed not only to utilize the data operationally, but also to leverage the potential for optimization they contain. On top of that, just because there might be a lot of data does not automatically mean that they are “good” data. The quality has to be right, too. This is often not the case, for example, when errors are made during data entry, data records are duplicated or data are out-of-date. This means that here, too, the company first needs to obtain an overview. In practice, however, this is often not so easy: just as you can no longer see the forest for the trees, the volume of data and the pressure of operational business prevent companies from navigating the data jungle.
How can you tell if there is enough data and “only” the overwhelming amount of data is making it difficult to use them effectively?
Here, it helps to consider which departments work with the data on a daily basis. “Where are the billing data from 2017 to 2021 again? Were there any cutback amounts involved? Are the master data still up-to-date? What does the attribute in column H mean? Does the Controlling Department also need all the data or is an extract sufficient?” These are typical questions that come up every day. In such cases, the company can devise business models and technologies no matter how innovative they may be – in practice, however, they are unlikely to be implemented on such a basis. At the same time, supporting processes and management processes are slowed down by the lack of transparency, which ultimately affects the core processes as well.

Expert Talk: “Digitization is a trialogue of business, IT and data strategy”
Many companies are concerned about their business and digitization strategy and ask themselves how they should go about addressing the issue. At Comma Soft, Dr. […]
Does this mean that before a data strategy can be developed, an overview of the status quo must first be created?
No, that should already be part of the data strategy. Nor can it be done with a one-time inventory. After all, new data are being added all the time. Systems in which they are created and processed continue to evolve, and processes change as well. Creating transparency through data is an ongoing process. Moreover, data should not be thought of as inflexible. Only when they interact and are used in processes do data assets, or in other words business-relevant added value, emerge. To do this, however, the data must also be readily available and it is essential to understand which data can create benefits and where. Many companies lack an overview of this, too.
How do you and your team help companies ensure that data and data assets provide them with transparency?
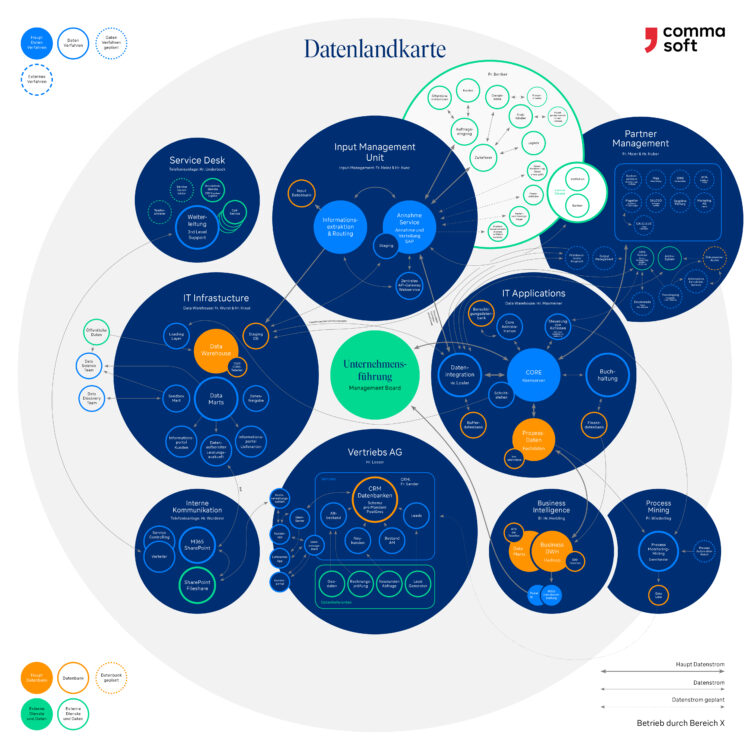
We work with employees in specialist departments, IT and management to look at where data are located, where they are used, and how they move around the company and the entire corporate ecosystem. In the process, we also identify bottlenecks and dead ends, and discover where untapped data resources lie dormant in silos. This is a complex process. A data map gives us a visual tool that makes it easier to understand all of this and identify dependencies. I have included an example of a German company’s map here.
What might the creation of such a data map look like in concrete terms?
We use semi-structured interviews with business and technical experts from the company. Questions for them include “Who works with which data and when? What are they used for in detail? What difficulties are encountered in the process? How are new data generated?” We structure the answers and present them in an interactive data map that combines perspectives from specialist department, business and technical infrastructure. The map is then iteratively developed with input from every area of the company and regularly updated.
What happens once a company has worked with you to create a data map? What do you do with it then?
It is important that the data map is made accessible to all employees in the company who have to work with data. This makes it clear that data value creation happens everywhere, when business value is derived from data, and that virtually every employee is involved. This begins at the consultant’s input screen, as only data that have been entered correctly will be of value later on in processes. Employees can help with this right from the outset. When they see how this benefits their own work and that of the company as a whole, it often increases their motivation and also their awareness of where there is further potential for optimization. This makes it possible, for example, to see where data handling and editing leads to additional or even duplication of work, which can be avoided through leaner data flows and sustainable data use. This provides a useful basis for considering where, for example, AI assistance solutions or automated processes can create further added value. The data map can be used to implement them in a holistic manner, rather than selectively in individual areas of the company.
Another point also becomes clear: some data that were necessary in earlier processes may no longer be so today. This means that it is also possible to streamline. At this point, I would also like to draw attention to the issue of data protection: where are the data stored, who has access to them, and how are they used? GDPR-compliant data management becomes virtually impossible without a thorough understanding of it. It is therefore not only about efficiency, but also about risk minimization.

Data Competence Training
Company track: Basic knowledge for all employees
Business track: Data competence for specialist departments
Operations track: Technical know-how for IT specialists & analysts […]
Looking back on your previous projects, what feedback do you get from companies that are already working with data maps?
For one thing, I hear directly from the departments that many tasks are becoming easier. Now that there is transparency and processes have been reorganized, many tedious tasks are no longer necessary. Data management itself is also simplified, with fewer redundancies and errors, eliminating a lot of time and effort. For another, we get feedback from those involved in the digital transformation of the company as a whole. The data map gives them more clarity about the level of digitization that the company has reached, what is possible for further transformation, and where they can take concrete action. Process improvement can also be carried out much more holistically within the company on this basis. The data map allows companies to think in terms of longer chains, from the creation and use of the data to the high quality of the data across the company. I always find it impressive how this tool creates a whole new spirit of optimism, anchors “data thinking” in the company and creates room for improvement and innovation!
If you would like to discuss data strategy and data maps, please reach out to Dr. Markus Knappitsch and his colleagues: you can get in touch with them here.